
Hello everyone, I am not a techie, but I was curious enough to attend a session by the name itself and wanted to write a blog about it in a very simplified manner. Yes, I recently attended a Webinar on how AI & ML can impact Cyber Security conducted by @ManageEngine, and here are the key takeaways that might come in handy for you!
So, let’s start with the terms addressed in the webinar!
Are AI, ML, and DL the Same?
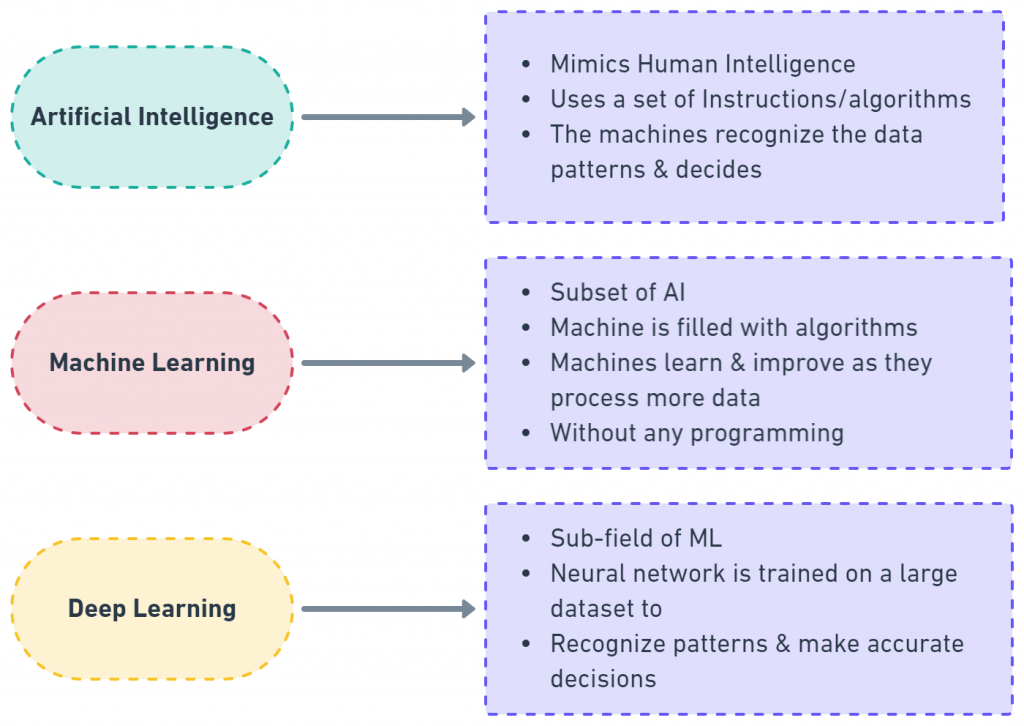
As you see, the concepts surrounding AI, ML, and Cybersecurity are all relative, but they are not the same. For instance, AI is a broader field that encompasses the techniques for making machines Smart-like humans. One among those various techniques is ML where the machines self-learn from data. Deep Learning(DL) is another technique within ML itself that makes machines smarter by using artificial neural networks to handle more tricky tasks.
Now that we have covered the keywords, let’s look into the salient takeaways from the webinar.
Cyber security is a word we all would have come across and may have thought that it isn’t related to us. Maybe, I think, I can help you here with simplified examples I learned from the webinar.
What is Cybersecurity?
When unauthorized or anomalous activities happen in a system, there can be theft or damage of confidential data and much more. Here is where the cyber security practices come into place with various practices like firewalls usage, Multi-factor Authentication (MFA), encryption, etc,. to minimize the damages.
How Are Unauthorized Or Anomalous Activities Identified?
Every employee in a particular network has a standard baseline of activity, any deviations from this baseline are considered anomalous. Now give this scenario some thought readers! Can these abnormal activities be taken lightly?
A big No!
The webinar spoke about how ML can be utilized in practicing cybersecurity. So, how is it interrelated to cybersecurity? Let’s explore this in detail.
When it comes to ML, there are 3 main techniques namely:
Supervised, Semi-supervised, and Unsupervised
Supervised Learning
Let’s begin our journey into Supervised Learning with an example. When we feed a long list of SQL files on network data, they are the samples and they get labeled as 1 or 0. The network data labeled as “0” will stand for malware, and the safe is marked as “1”. Over time, the system learns the malware data and what is safe and then predicts when a new file is provided.
The data fed are trained and tested.
Using the training data, a training model is created that will help make predictions and evaluate whether they are credible. The system works with the Security Analyst’s (SA) feedback and learns from them. It uses this learning for the next time.
Unsupervised Learning
In unsupervised learning, only inputs are fed. It’s up to the system to discover the patterns in the data. Once the pattern gets deciphered, it is shown to the Security Analysts (SA). And the corrective actions are taken.
In the beginning, the system looks into the data and tries to understand it without distinguishing it as right and wrong. One of the best ways to implement unsupervised learning is by using clustering data. Here, the system creates a group of entities or clusters based on similar behavior. Data comes in and is then transformed into clusters.
So, here is how clustering works:
A group of users who log in simultaneously into one network is grouped under 1.
Users who access certain servers can be clustered 2
Users accessing a server at a certain time can be 3
This is how clustering works.
Semi-Supervised Learning
It is a combination of both supervised and unsupervised learning. In this type of learning, a few pieces of data are labeled and a few are not labeled. This brings unique circumstances to the Security Analyst and analyzes the patterns of the data to cluster them.
The unknown info about data is received here and the Security analyst uses the DIKIW model which is Data, Information, Knowledge, Intelligence, and Wisdom.
That said, regardless of the method a company chooses, it should primarily ensure that all data across the network is obtained. This includes data from network devices such as routers, switches, and firewalls, as well as network file shares such as databases and applications.
These applications may be self-developed, owned by the organization, or third-party applications, but it’s crucial to get data from all of them. In addition, data should be collected from Active Directory, cloud infrastructure, and privileged access management systems.
Once the data gets collected, analysis and contextualization begin.
Anomalies in Detail
We have 3 primary types of anomalies based on time, pattern & count. Here are some interesting examples which you can easily relate to.
i) Time
Here questions such as, “Did a user log in at an unexpected time?” are raised.
Ex: Steve should usually log in between 2 – 2.15 pm but log in at 1 am. Here, the Security Analyst has a question about the anomalous activity.
ii) Pattern
Did a user log on at an unexpected time or out of range?
Ex: Steve’s log time is between 2 and 2.15 pm but he has logged at 1 am which is very strange.
iii) Count
When our software and services are being installed on force way too many times
Ex. Martin installed an app 250 times but the threshold here is only 7 times.
Security Analyst deducts the unusual patterns & sequences here.
Ex: Software installed at 5 am done by a user on a particular IP address, hostname, and user name is fine but the deviation is the time here.
When these types of anomalous activities happen, the security Analyst sets a baseline for every activity. To ensure that the baseline is analytical, the security Analyst sets a risk score from which they can calculate the deviation.
Security analysts can not be dark about what goes on in the backend. They should be able to calculate the deviation between the observed and expected values. The deviation and risk are proportional to each other here. The anomaly deduction engine should support all this.
Insider threats include data deletion, file permission changes, and a high number of user management activities.
Account compromise includes Log on anomalies, multiple system file changes, and event log deletions.
Data exfiltration includes abnormal software installations, data hoarding activities, abnormal file downloads, and abnormal file.
Log-on anomalies are Log on failure and log-on success anomalies.
Every organization is unique in its own way, likewise, the risk score also differs accordingly. The organization should know what kind of anomalies can occur in theirs. And then the Security Analyst assigns a weightage to each anomalous activity which will help in calculating risk scores. The Security Analyst sets up a risk score that will help them in prioritizing the riskier anomaly activities.
Similar to the risk score, the decay factor – which is how soon the risk score can be brought down should also need to be defined. Building a timeline of anomalies is very important to get the full context of a cyber attack. It will let us know the sequence of steps followed when a cyber-attack actually takes place.
Practical use case: For Better Perfection
Here is a practical Data exfiltration attempts at how a cyber security attack happens.
On Day 1, an external attacker sends a phishing email with a malicious attachment to a frontend employee John. When he clicks the attachment, the content gets downloaded and malware gets installed. Here the attacker gets an initial footprint of the network and steals John’s credentials. Using it, he connects to the network from a remote location.
After a huge gap, on day 7, the attacker gets hold of a system admin with ten failed logins and one successful login within 30 mins. Here count & time anomaly gets triggered and raises the risk.
On day 9, the attacker uses the System admin’s credentials to log in.
On day 10, the attacker attacks a high number of confidential databases, unusually.
As the days go by, the risk score gets increased, and the Security Analyst sets an alert if it goes beyond the threshold. This is how in a practical world, anomaly deduction happens.
And here is where ManageEngine’s Log360 comes into place! Log360 has the capability of UEBA – User Entry Behavior Analytics which is the anomaly deduction engine of Log 360.
In the main dashboard of Log360 UEBA – the number of events ingested in a specific time range, anomalies deducted in the network, number of users we are tracking, list of abnormal alerts in the network, top 10 anomalous activities, anomalies based on categories (like based on SQL server), distribution of risk levels are available.
Anomaly report statistics show different anomalies like logon anomalies based on time, patterns & count with the user name, time, server, OS, and risk score, which are available
This allows you to prioritize the activities, their risk score, and the decay factor. If you plan to know more about it, you can click here!
Thank you for reading! Happy learning, everyone:)