
Charts are getting important in our applications day by day , users now prefer diagrammatic representations that looking at a table and understanding the data flow , here is a little demonstration of how we can implement charts in iOS using react native .

Things we need to do
1.Install react-native dev environment
2.Install react-native-charts components
1.React native Environment
This is an obvious step and I let you figure out the best way to get it done.
2.Install react-native-charts
To install and configure react-native-charts please follow the following procedures
1.Install the package
go to your project directory then enter the following command
[source=’bash’]
$npm install react-native-chart
[/source]
The package will be installed inside the node_modules inside your current path
now open Xcode with your project in it for that follow the command
[source=’bash’]
$open ios/[yourprojectsname].xcodeproj
[/source]
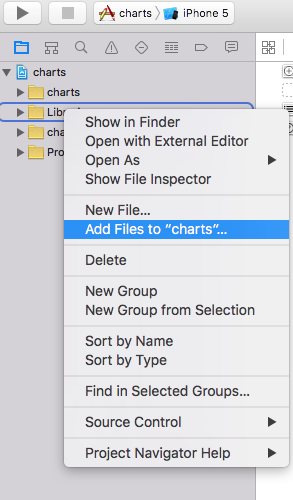
go to the sidebar of your project right click on the Libraries and choose Add Files to “yourproject” and select RNChart.xcodeproj which is under node_modules/react-native-chart like this
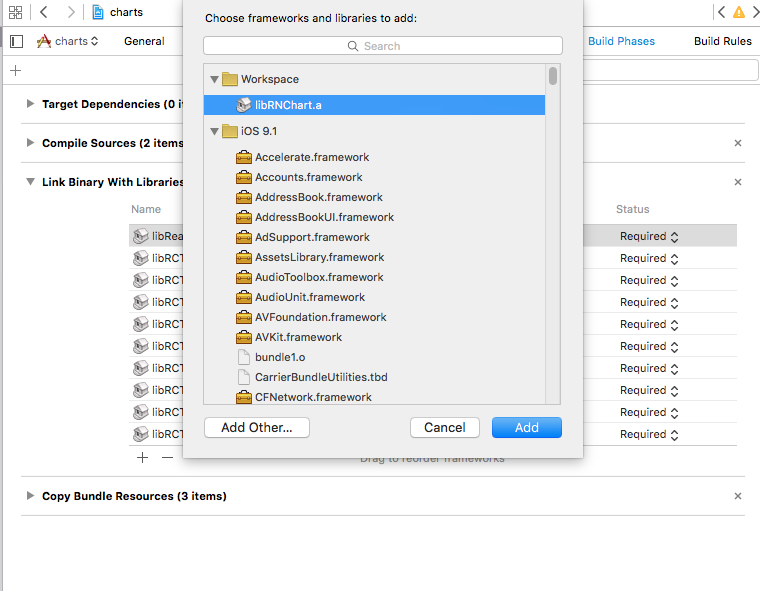
Now go to the projects Build Phases and under Link Binary with Libraries click the + symbol and add libRNChart.a to the Build Phases like this
now you can access the charts anywhere inside your application using require like this
[source=’js’]
var RNChart = require(‘react-native-chart’);
[/source]
Now all of that done lets look at the charts component code , to use the chart you need to first specify the chartData (now i have kept is static) and also the labels for x-y axis Lets see how we can do that.
chart data
[source=’js’]
var chartData = [
{
name:’BarChart’,
type:’bar’,
color:’white’,
widthPercent:0.6,
data:[
30, 1, 1, 2, 3, 5, 21, 13, 21, 34, 55, 30
]
},
{
name:’LineChart’,
color:’white’,
lineWidth:2,
showDataPoint:false,
data:[
10, 12, 14, 25, 31, 52, 41, 31, 52, 66, 22, 11
]
}
];
[/source]
Labels
[source=’js’]
var xLabels = [‘0′,’1′,’2′,’3′,’4′,’5′,’6′,’7′,’8′,’9′,’10’,’11’];
[/source]
now in the render function
[source=’js’]
[/source]
style for the same
[source=’js’]
var styles = StyleSheet.create({
container: {
flex: 1,
backgroundColor: ‘white’,
},
singleCardHeart:{
flex:1,
backgroundColor: ‘#71EAB2’,
},
chart: {
top: 16,
left: 4,
bottom: 4,
right: 16,
height:150,
width:250,
marginBottom:40
},
})
[/source]
Thats it you can customise the charts as you wish for the api reference you can go here to the charts package github
This whole project example is in this github repo
Thats it enjoy.
GOT A PROJECT IN MIND?
Get in touch with us by checking the contact us form. We got best engineers to help you.
You might wanna format the code a little. I’d also recommend checking out React Native Charts if you don’t want to build them from scratch.